CSS and HBF Star Ratings Scheme
The National New Homes Customer Satisfaction Survey and HBF Star Rating scheme launched in 2005 and is one of the UK’s most comprehensive industry research initiatives.
Download the latest star rating logos
View and download the scheme's brand guidelines and promotional materials.
2025 HBF Star Rating results
The 2025 National New Homes Customer Satisfaction Survey results show that 94% of new build home buyers would ‘recommend their builder to a friend’, the fifth successive year that the industry has upheld a score of 90% or above.
The scores represent a 4% lift on last year and mark half a decade of the industry achieving a score of 90% or above
| Home builder | Sample Surveyed | HBF Star Rating** | |||
|---|---|---|---|---|---|
| A & J Stephen | 16 | ||||
| Allison Homes | 117 | ||||
| Amethyst Homes | 20 | ||||
| Avant Homes | 848 | ||||
| Bargate Homes | 32 | ||||
| Barratt Developments | 5852 | ||||
| Beal Developments | 72 | ||||
| Bellway Homes | 4035 | ||||
| Bloor Homes | 1740 | ||||
| CALA Group | 1209 | ||||
| Cameron Homes | 80 | ||||
| Campion Homes | 26 | ||||
| Castle Green Homes | 109 | ||||
| Cavanna Homes | 55 | ||||
| Churchill Living | 215 | ||||
| Crest Nicholson | 560 | ||||
| Croudace Homes | 113 | ||||
| Cruden Homes | 28 | ||||
| Dandara Homes | 397 | ||||
| Davidsons Developments | 293 | ||||
| Denbury Homes | 38 | ||||
| Durkan | 43 | ||||
| Hayfield Homes | 69 | ||||
| Hill Holdings | 248 | ||||
| Hopkins Homes | 199 | ||||
| Jones Homes | 150 | ||||
| Keepmoat | 1044 | ||||
| Kingswood Homes | 33 | ||||
| Lagan Homes | 95 | ||||
| Lioncourt Homes | 66 | ||||
| Lovell Partnerships | 366 | ||||
| M F Freeman | 28 | ||||
| McCarthy Stone | 377 | ||||
| Miller Homes | 1589 | ||||
| Morris Homes | 221 | ||||
| Norfolk Homes | 34 | ||||
| Orbit Homes | 63 | ||||
| Persimmon Homes | 5016 | ||||
| Redrow Homes | 1809 | ||||
| Robertson Homes | 161 | ||||
| Rose Builders | 27 | ||||
| Spitfire Homes | 81 | ||||
| St Modwen | 481 | ||||
| Stancliffe Homes | 22 | ||||
| Stonebond Properties | 29 | ||||
| Story Homes | 598 | ||||
| Strata Homes | 181 | ||||
| Taylor Wimpey | 3904 | ||||
| Thakeham Group | 55 | ||||
| Tilia Homes | 267 | ||||
| Vistry Homes | 2459 | ||||
| Wain Homes | 421 | ||||
| William Davis | 79 | ||||
Useful links
Download the CSS and HBF Star Ratings scheme rules
View frequently asked questions
Star rating brochures
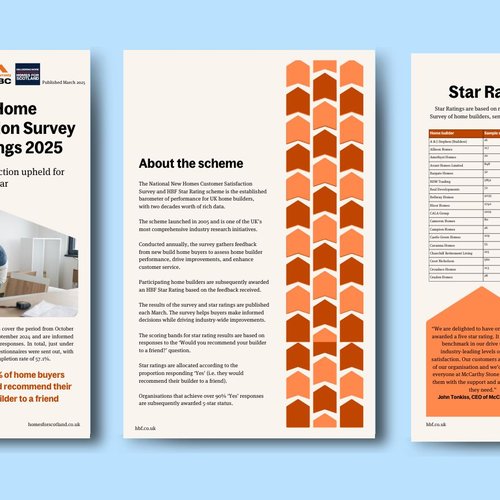
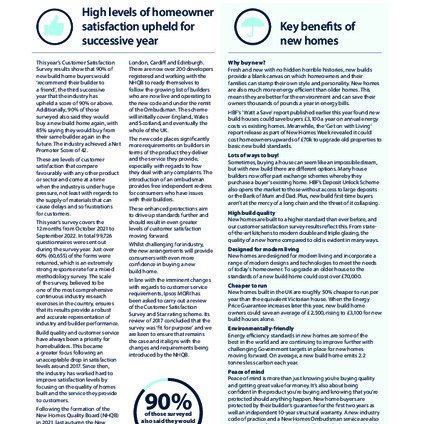
The HBF Star Ratings brochure includes helpful context on the National Customer Satisfaction Survey and HBF Star Rating scheme, as well as the most recent year's results. Download the brochure for use internally and with consumers.

20th Survey CSS 2025 (Completions October 2023 - September 2024)

19th Survey CSS 2024 (Completions October 2022 - September 2023)

18th Survey CSS 2023 (Completions October 2021 - September 2022)
Rolling 12-month data table
The rolling 12-month data table is updated every quarter to provide an indication of customer satisfaction.
Please refer to our FAQs for more details on how the results are calculated.
| Home builder | Sample Surveyed | Percentage | |||
|---|---|---|---|---|---|
| A & J Stephen | 13 | 100% | |||
| Allison Homes Ltd | 128 | 92.1% | |||
| Avant Homes | 856 | 91.1% | |||
| Barratt Developments | 5647 | 95.9% | |||
| Beal Developments | 94 | 95.7% | |||
| Bellway Homes | 4115 | 95.8% | |||
| Bloor Homes | 1726 | 97.6% | |||
| CALA Homes | 1094 | 96.4% | |||
| Cameron Homes | 69 | 94.2% | |||
| Campion Homes | 27 | 96.3% | |||
| Castle Green Homes | 127 | 97.6% | |||
| Cavanna Homes | 38 | 86.8% | |||
| Churchill Retirement Living | 225 | 95.2% | |||
| Crest Nicholson | 514 | 96.3% | |||
| Croudace Homes | 106 | 93.3% | |||
| Cruden Homes | 39 | 86.8% | |||
| Dandara Homes | 383 | 98.2% | |||
| Davidsons Developments | 309 | 95.1% | |||
| Denbury Homes | 40 | 95% | |||
| Durkan | 42 | 92.7% | |||
| Hayfield Homes | 46 | 91.3% | |||
| Hill | 199 | 93.4% | |||
| Hopkins Homes | 210 | 96.7% | |||
| Jones Homes | 162 | 94.3% | |||
| Keepmoat | 999 | 94.1% | |||
| Kingswood Homes | 41 | 97.6% | |||
| Lagan Homes | 123 | 92.6% | |||
| Lioncourt Homes | 69 | 97.1% | |||
| Lovell | 336 | 92.5% | |||
| M F Freeman | 25 | 100% | |||
| McCarthy & Stone | 315 | 92.4% | |||
| Miller Homes | 1617 | 95.3% | |||
| Morris Homes | 240 | 97.1% | |||
| Norfolk Homes | 34 | 100% | |||
| Orbit Homes | 61 | 98.4% | |||
| Persimmon Homes | 5270 | 94.9% | |||
| Redrow Homes | 1827 | 95.6% | |||
| Robertson | 47 | 96.2% | |||
| Rose Builders | 28 | 100% | |||
| Spitfire Homes | 46 | 94.4% | |||
| St Modwen | 165 | 96.8% | |||
| Stonebond Properties | 30 | 100% | |||
| Story Homes | 545 | 95.2% | |||
| Strata Homes | 170 | 94.7% | |||
| Taylor Wimpey | 3915 | 95.6% | |||
| Thakeham Homes | 56 | 92.6% | |||
| Tilia Homes | 280 | 94.3% | |||
| Vistry Homes | 2249 | 93.6% | |||
| Wainhomes | 420 | 91.1% | |||
| William Davis | 70 | 95.7% | |||
For Q1 2019 scores were rounded up or down to the nearest full percentage point. Numbers up to .5 were rounded down; numbers from .5 were rounded up. (i.e 94.3% would be rounded down to 94% and a score of 94.6 would be rounded up to 95%)

Home builder ready to sign up?
All HBF members can sign up to the scheme. Complete our short form to receive details on the steps to joining.
Sign up today