Last updated: 20 Jan 2026
Introduction
The gap between what prospective buyers can realistically afford to borrow and the actual cost of purchasing a home has widened significantly in recent years, with the greatest pressure being felt across the southern and eastern regions of the country. Since the closure of the Help to Buy scheme in 2023, the Home Builders Federation (HBF) has consistently urged policymakers to place greater emphasis on the demand side of the housing market.
While headline demand for housing remains extremely high, translating this demand into effective demand, buyers who are both willing and financially able to purchase, is becoming increasingly difficult. The availability, accessibility, and affordability of mortgage finance play a decisive role in determining whether this demand can be realised in practice.
A growing number of structural barriers are preventing large sections of the population, particularly younger generations, from accessing home ownership. High deposit requirements, stringent lending criteria, stagnant wage growth relative to house prices, and elevated interest rates have collectively created an environment in which buying a home is beyond reach for many. Collectively, these factors have contributed to a pronounced affordability gap that threatens the sustainability of housing demand and undermines long-term market stability.
If left unaddressed, these dynamics risk entrenching inequalities in housing access and diminishing social mobility. It is therefore imperative that policymakers develop and implement measures that support the demand side of the market through improved access to mortgage finance and targeted assistance for first-time buyers.
Missing buyers
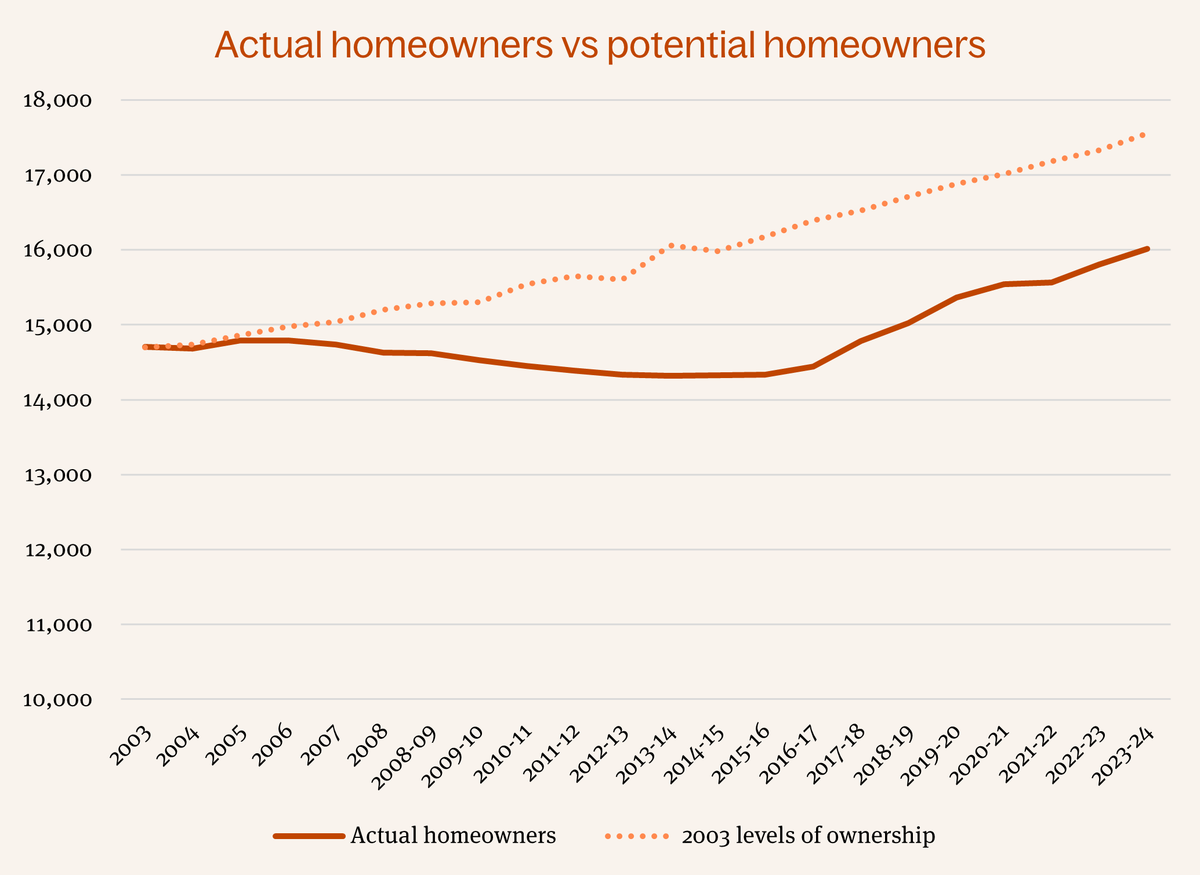
Levels of home ownership in England peaked in 2003, at 71% of the population, equivalent to 14.7 million households. As of 2024, levels of home ownership had dropped to 64.8%. While population growth means that in straight numbers, the number of home owning households increased to just over 16 million, the 6.2% drop in overall proportion represents over 1.5 million households that would be homeowners had the 2003 levels been sustained.
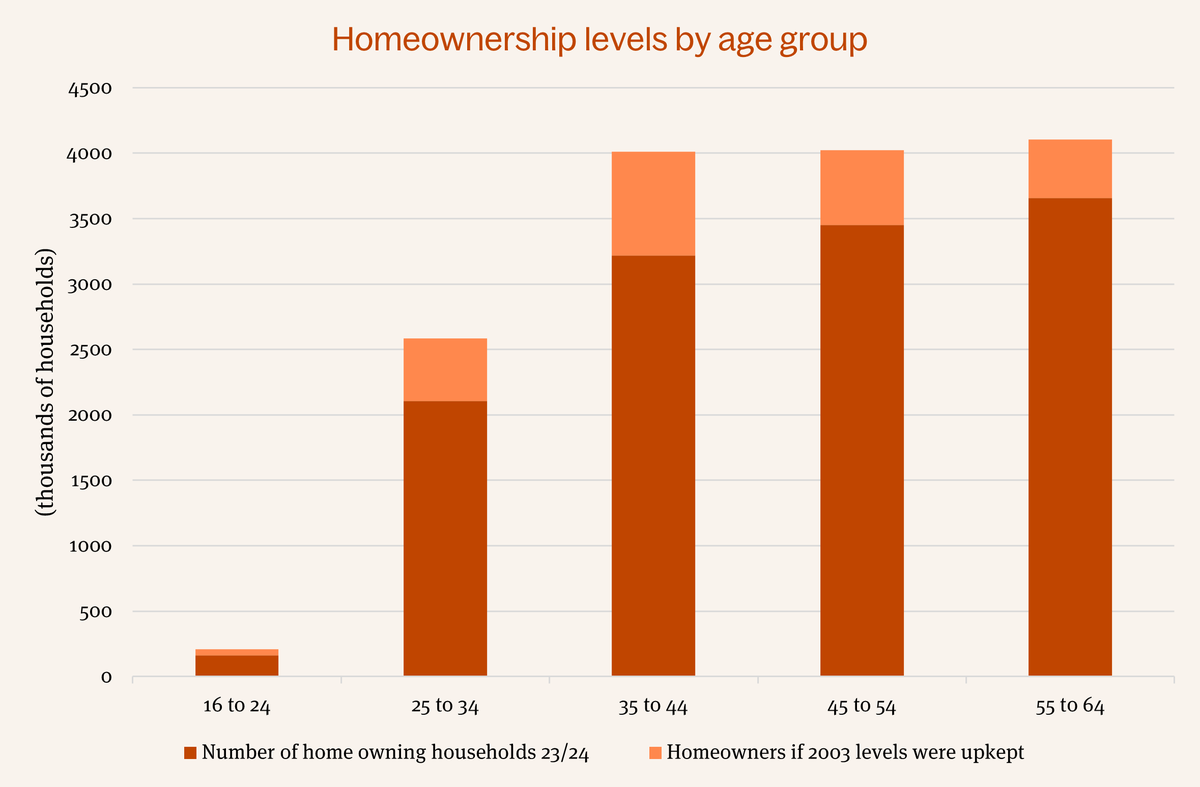
This drop has impacted all age groups, except 65+. The age group that has seen the biggest drop is 35-44 year olds, which would have an additional 800,000 owning households. 25-34, 45-54, and 55-64 year old households have all seen drops of approximately 500,000 in the 20 year period, whilst 16-24 year olds saw a drop of 50,000. 65+ year olds have seen an increase of 540,000, as wealth becomes increasingly entrenched in a smaller group of people.
Deposits
The first barrier is saving for a deposit. The vast majority of approved mortgages are for loan to value (LTV) ratios of below 90%, with less than 10% of mortgages for LTVs greater than this .
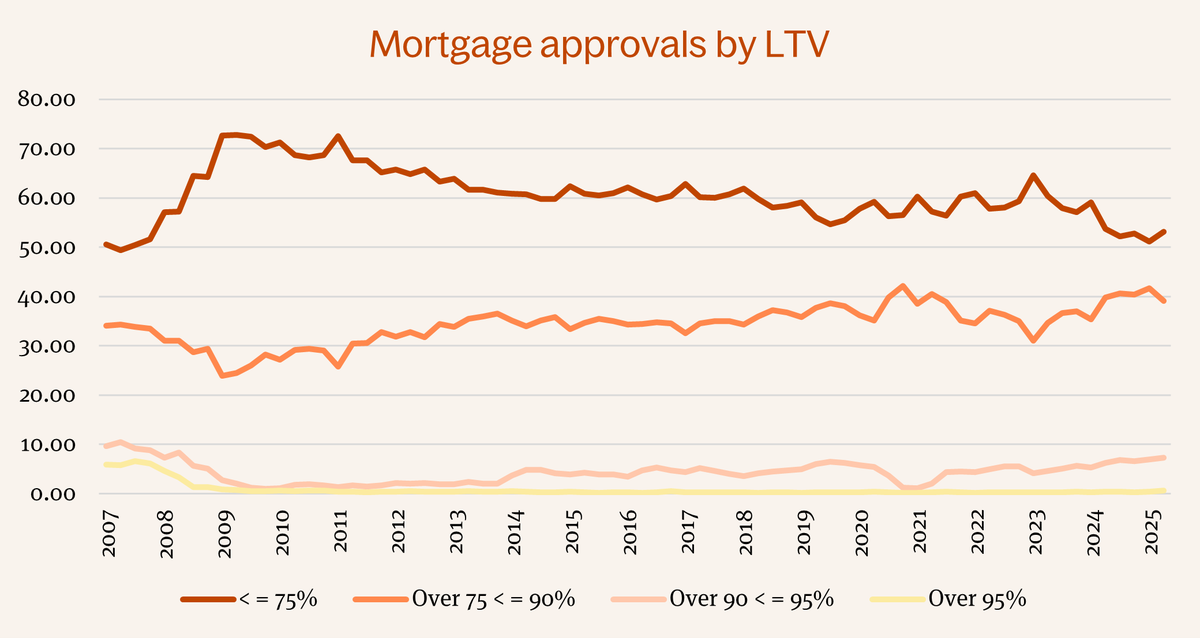

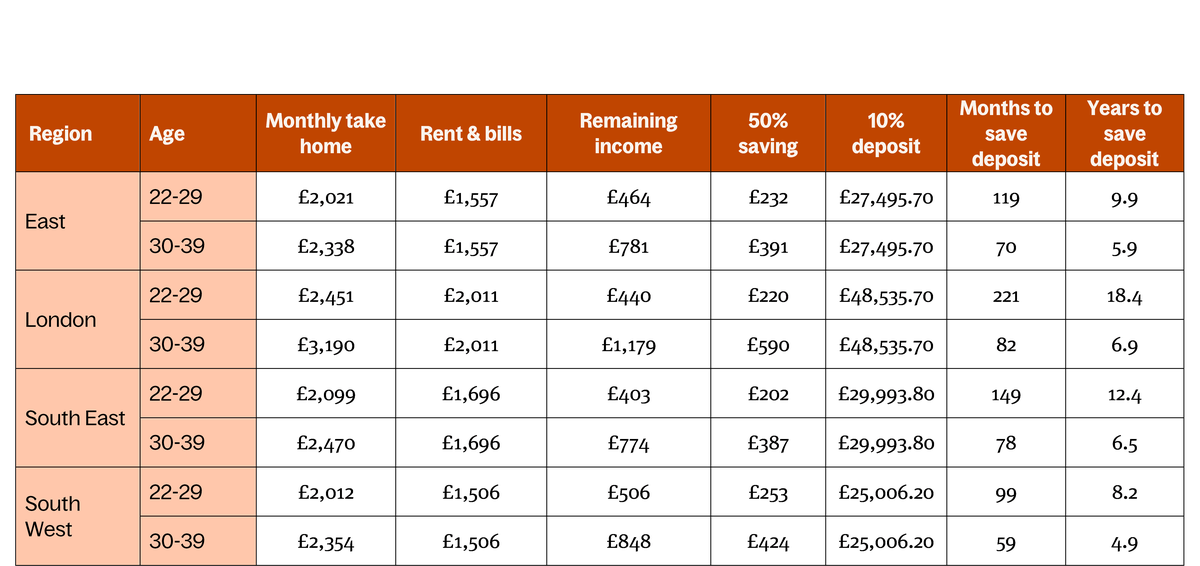
As such, most prospective buyers will need to save at least a 10% deposit in order to purchase a home. This is a substantial hurdle, especially given current rent levels and living costs. Even under relatively optimistic assumptions – being able to save 50% of disposable income each month – it would take over seven years to save the required deposit. During this time, the buyer must also contend with potential increases in house prices, rent inflation, and other living costs, all of which make the goal increasingly difficult to reach.
This becomes even more severe in the more expensive regions of the country – London, East of England, South East and South West and is consistent among 22-29 year old and 30-29 year old earners.
Affordability gap
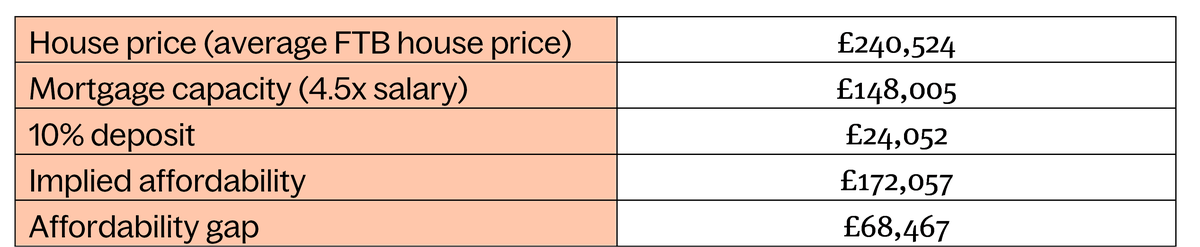
And even if the 10% deposit is saved, house prices that have outpaced wages for decades in so many areas of the country means that there is a significant affordability gap remaining. Based on an average of 4.5x Loan to Income mortgage, there is an average affordability gap of almost £70,000.
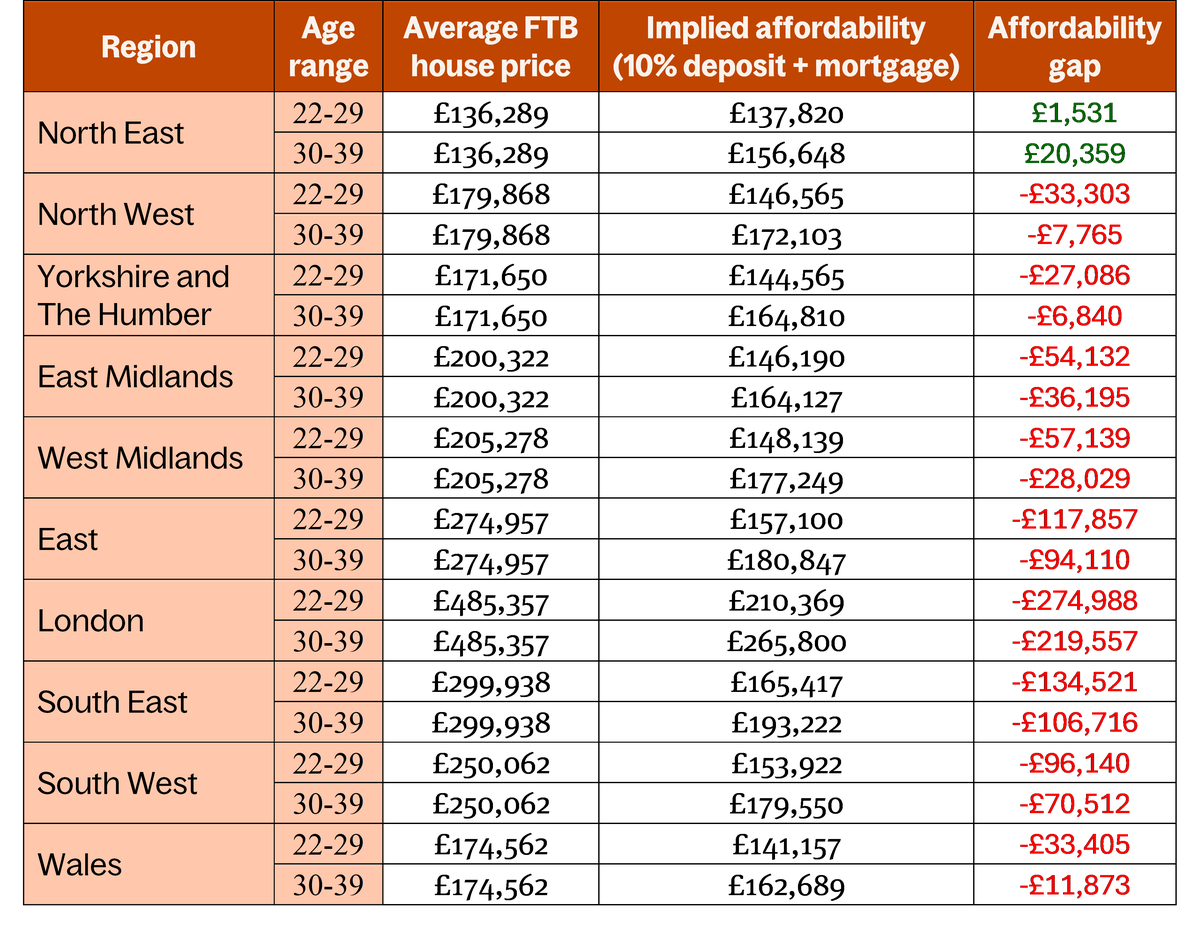
Only in the North East can the average earner in both the 22-29 and 30-39 age cohorts realistically buy a home. In London, the affordability gap is over double the national average at £275,000 and £220,000 for 22-29 year olds and 30-39 year olds respectively.
And while the above tables look at the struggles facing those on the median salary for each of the age cohorts, the affordability struggles extend to those even on the highest incomes.
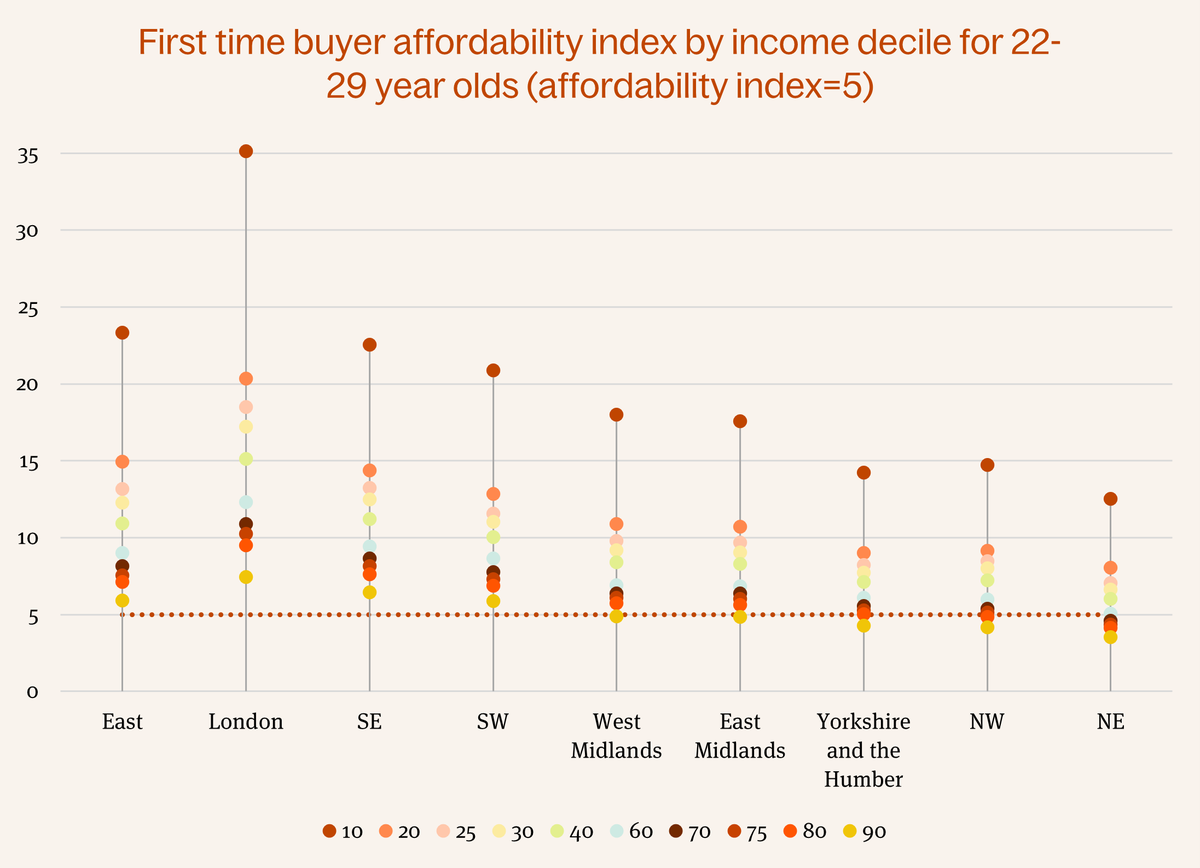
This issue is particularly acute among earners under 30. As illustrated in the graph below, in four of the nine regions in England, the house price-to-income ratio renders home ownership unaffordable even for those in the highest income decile. In a further three regions, only those in the top 10% of earners could afford to purchase an averagely priced first-time buyer home. Even in the North East – the most affordable region by this measure – only the top three income deciles could feasibly buy a home, effectively excluding around 70% of younger earners from ownership opportunities.
For the 30–39 age group, the picture is only marginally better. Despite typically earning higher wages than those aged 22–29, this cohort continues to face significant barriers to ownership. In the five most expensive regions, only the highest-earning decile had an average house price-to-income ratio below five, the level generally considered a threshold for affordability. Even in the North East, affordability was limited to the top four income deciles, underscoring how housing costs have outpaced income growth across nearly all segments of the market.

These findings underline the deepening structural imbalance between wages and housing costs, where the traditional pathway to ownership, particularly for younger adults, is increasingly out of reach, even for high earners.
A new First Time Buyer scheme
All conclusions about the housing market point to a need to intervene and assist potential first time buyers onto the market. The most effective way to do this is through an equity loan scheme, many iterations of which have featured in the market particularly over the last two decades.
HBF has long urged the Government to consider a replacement scheme to bridge the homeownership gap. A new scheme could:
- Boost first-time buyers’ deposits, giving them access to new build mortgages which are more affordably priced
- See developers paying a fee similar to the ‘commercial fee’ payable by mortgage lenders for access to the Mortgage Guarantee Scheme
- Involve developers covering a portion of the upfront investment in the form of a fee which would see HMG retain the full equity share
A 15% equity loan scheme for first-time buyer purchasers of new build homes would be part-funded by a developer contribution. Developers would effectively pay a fee in return for their buyers having access to the initiative. This fee, set initially at 1% would be equivalent to the commercial fee paid by lenders for the protection offered by HMT’s Mortgage Guarantee Scheme. The equity loan would be interest-free for five years.
We propose that this fee starts at 1% of the property’s value. This rate would apply to the first 100 transactions for each participating builder that are supported by the scheme. A rate of 2% could apply to transactions after this point up to, say, 1,000 completions (for administrative purposes, this could be triggered at the end of a quarter or other equivalent period). Thereafter, a 3% fee could apply, meaning that (a) larger developers whose purchasers use the scheme more will ultimately pay a blended rate much closer to 3% than 1%, and (b) the government’s average equity loan would be between 12% and 14% while holding a 15% equity stake in each qualifying property.
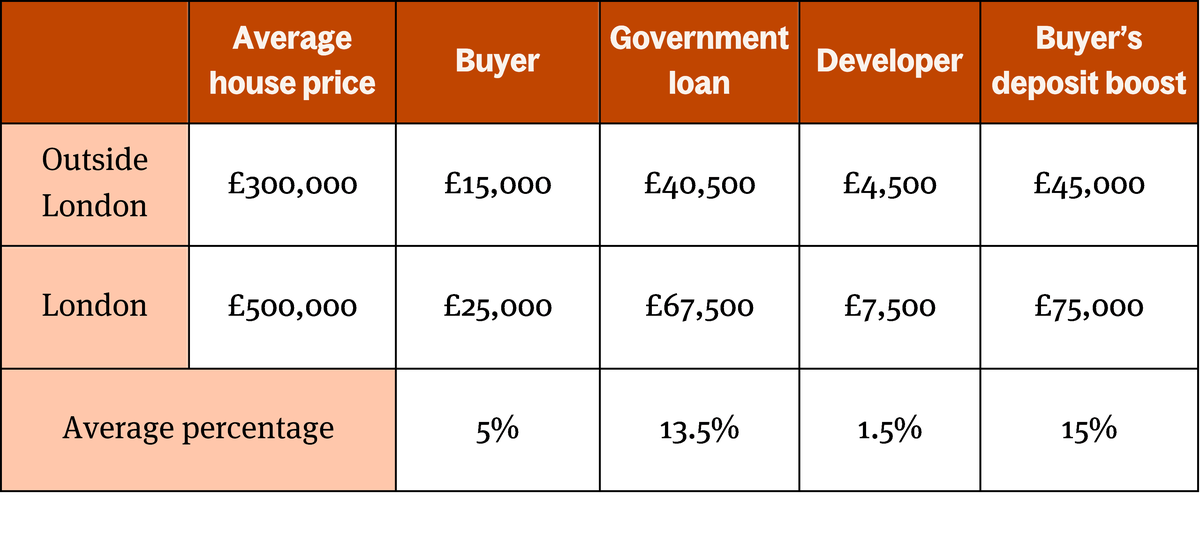
The table below shows how this would work on an individual basis with a buyer’s deposit requirement for a £300,000 new build home halving to £15,000 thanks to a Deposit Boost of £45,000, giving the buyer an effective 20% deposit. The 15% Deposit Boost would be funded by a combination of government equity loan and developer fee (with an assumed average of 1.5% blended rate fee across the portfolio).
A £500,000 property in London might see a typical developer fee of £7,500 in exchange for their purchaser having access to the government support.
The developer contribution is in the form of a fee and no equity stake would be taken by the developer meaning that the government retains a 15% equity stake in the portfolio. When the equity loan is paid off, Government would receive 15% of the value of the property despite the net upfront contribution having been a maximum of 14% of the property value at origination and, on a blended basis, even lower. This means the likely returns on the loan book would be even greater for the Exchequer than has been seen through Help to Buy.