
Why is it so difficult to count new homes?
In today’s data age, having a complete view of data is a given. So, real-time data on housing supply should be easy to come by. Shouldn’t it?
Executive Director at the Home Builders Federation, David O’Leary studies existing data sets and the validity of retrospective government statistics to determine why it’s so difficult to get a clear, timely view of housing numbers.
Compared with other areas of policy and economic outcomes, it feels that it ought to be reasonably easy to count the number of new homes that have been completed over any given period. After all, boosting housing supply has, for some time now, been identified as a major policy priority for governments and elected representatives.
But the truth is any accurate sense of housing delivery over recent months can only be built through a complex triangulation of alternative proxies and a bit of intuition.
Many of us bemoan the quality of debate around housing supply as we’re beset by mistruths and ‘dead cat’ statistics.
Having a clear and up-to-date measure of how many new houses have actually been built would be a useful starting point and offer some comfort that the subject is being taken seriously by policymakers.
The problem with housing statistics
Last week the Department for Levelling Up, Housing and Communities (DLUHC) published the latest edition of its Net Supply of Housing Statistics.
You could be forgiven for missing the excitement.
Not only did the latest number reflect a complete flatline from the previous year’s headline figure, but the utility of the data also suffers from the fact that whatever is published each November reflects a historic position.
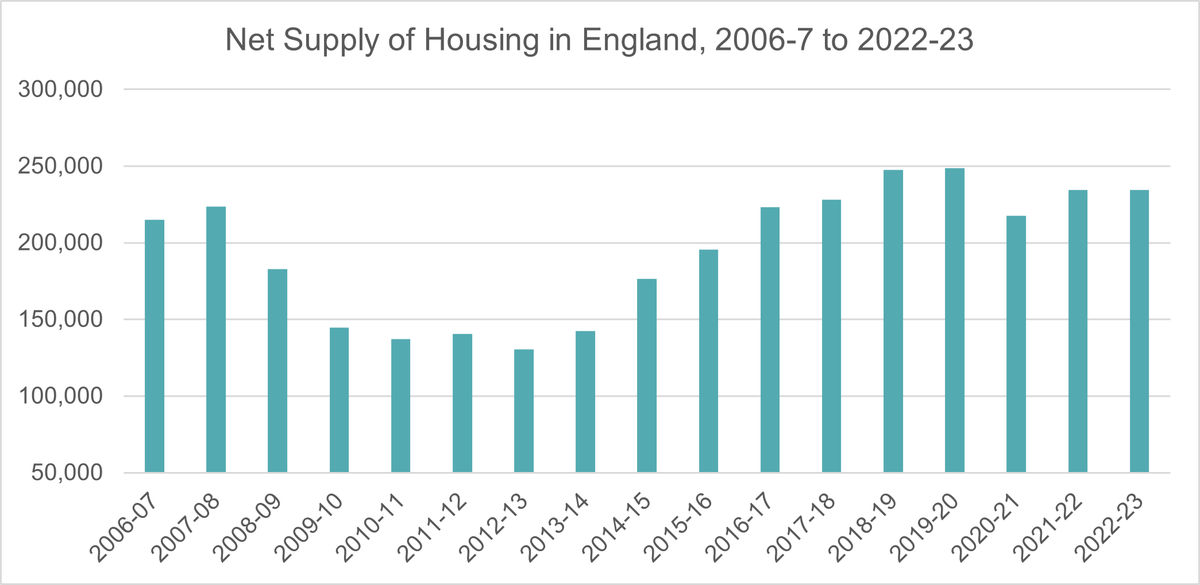
For instance, last week, as we hurtle towards the end of 2023, we learned that 239,871 new homes were built in England between April 2022 and March 2023.
Offsetting demolitions, Net Housing Supply – the Government’s key measure relevant to its 300,000 annual new homes delivery target – stood at around 234,000, down by a whole 65 from the 2021-22 number. Given that these homes were all completed between nine and 20 months ago, this data clearly does not provide a clear picture of what is actually happening in the industry and the market today.
The figures do provide a picture of housing delivery at a local authority level. But beyond that there is no further granularity in terms of whether the new homes are flats or houses, their tenure or the type of developer responsible.
It is no surprise then that interested parties, from journalists to Select Committees, go looking for a more contemporaneous perspective.
The first port of call is usually a dataset alluringly entitled ‘Indicators of Housing Supply’, published on a quarterly basis, again by DLUHC. This also features a supposed split between broad tenures – private, council, other social.
So far, so good.
Except that the statistics routinely undercount housing delivery and the private/public offers only a highly rudimentary analysis that renders it pointless.
Indeed, this is a data series that up until recent years was known as ‘Housebuilding Statistics’. While giving an impression of a comprehensive dataset, the reality was the numbers were produced using voluntary returns from Building Control providers.
It took a UK Statistics Authority review in 2017 and recommendations from the effective national statistics regulator to fix this startlingly obvious misnomer.
But the review and the subsequent renaming has done little to improve the accuracy of the numbers.
In fact, they have become less accurate.
Unrecorded data
In the five years between 2018 and 2022, we know from the Net Supply Statistics that 1,030,810 new build completions were recorded.
But the Indicators of Housing Supply Statistics counted only around 80% of these completions with the majority of the 200,000 homes ‘lost’ in the numbers being in urban areas.
That’s equivalent to the dwelling stock of Manchester.
For instance, in 2021-22, almost 14,000 new build completions in London went unrecorded (44% of the total) in addition to more than 500 in Leicester and 700 in Birmingham.
Government remains aware of the inaccuracy of the numbers but continues to publish them on the grounds that the dataset goes back to the Second World War and can supposedly be used to decipher trends.
Further, the split of public and private development is determined only by the status of the main developer and is therefore over-simplified. That is, Section 106 Affordable Homes built by a private developer will be considered ‘private’ while a home built by a Housing Association for private sale will be tagged as ‘public’.
Useful proxies
Energy Performance Certificates (EPCs)
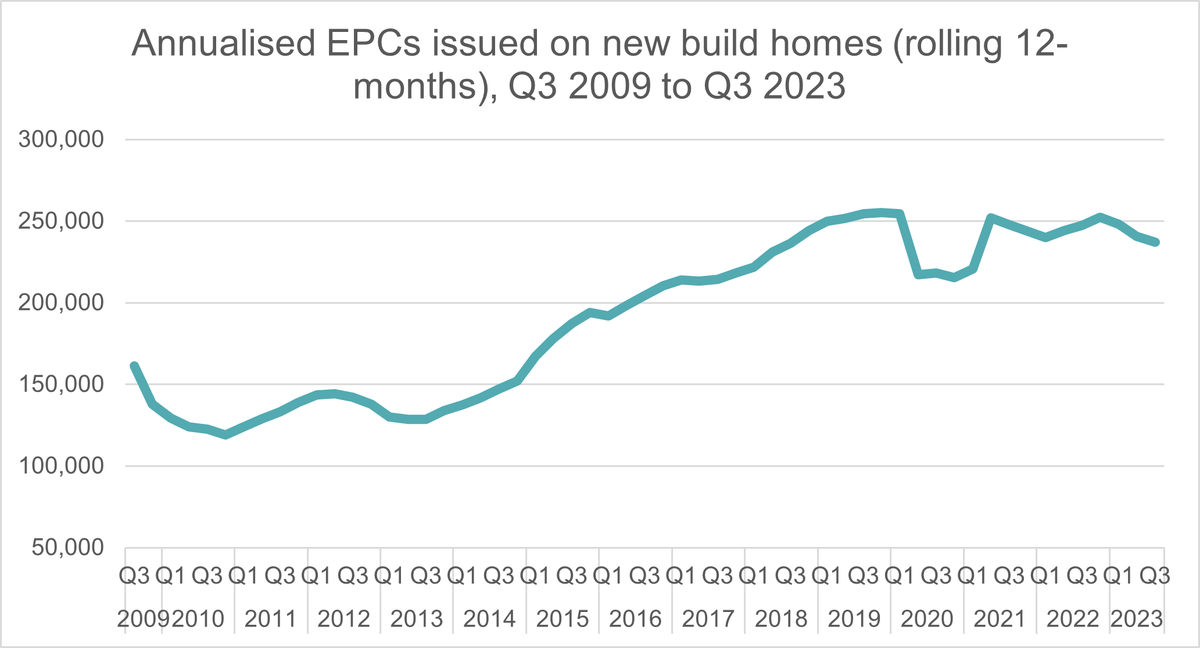
Since 2008, DLUHC has published data on a quarterly basis on properties issued with Energy Performance Certificates (EPCs).
Although the majority of the data pertains to existing properties as they are marketed, a subset is available that is specific to new build properties.
The availability of these important housing supply statistics is simply an accident of the drive in the 2000s to improve the provision of information on energy performance of buildings.
The differentiation between new and existing properties now allows us, 15 years on, to have a reasonable picture of the number of homes being built.
The quarterly EPC Statistics have become the most reliable data on very recent housing supply. When retrospectively compared to the Net Supply data published midway through each financial year, the data presents only minimal variance (and some of this appears to be lagging factors so that over a multi-year period the variance is reduced).
The EPC statistics are published shortly after the end of each quarter. They are available at a local authority level and provide information on some aspects of new build supply including EPC rating (A-G); CO2 emissions; floor area; type of property. They do not, however, provide breakdowns of developer type or the number of bedrooms per property.
Dwelling Stock
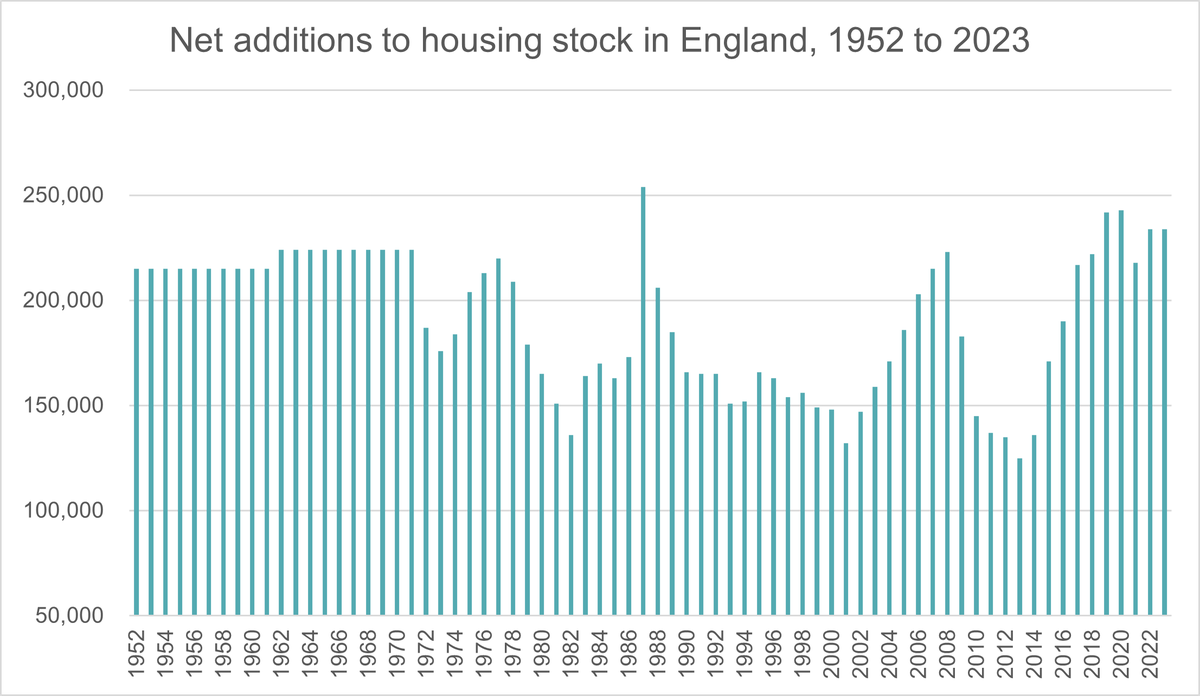
The Dwelling Stock statistics published by DLUHC in May each year provide a measure of net supply that correlates with the Net Supply of Housing Statistics. They dataset also provides historical context for this measure with some numbers dating from 1801, albeit with updates made once per decade up to 1970.
This source provides the best record of long-term net supply.
It also helps illustrate the housing supply successes of the 2014 to 2019 period and, indeed, even up to 2023.
By comparing to the net output of the 1950s and 1960s, we can see the delivery of recent years stands up historically as a considerable achievement.
However, while useful for historical long-run comparisons, this data is only produced annually and offers little granularity.
Council Taxbase
Also published by DLUHC, the Council Taxbase statistics represent another measure that helps to triangulate net housing supply for England and correlates well with net supply statistics.
It is published in November but covers a more recent delivery than the Net Supply Statistics, with the recording period running for a year up to the second Monday of the preceding September.
Why we need an improved data sets
Given the political attention on housing supply and the role of house builders, it is both surprising and disappointing that the quality and granularity of statistics remains poor.
The addition in 2008 of EPC statistics as a proxy for housing supply data which arose as a by-product of regulation focused elsewhere is welcome. However the multitude of statistics, some of which fail to accurately reflect market realities, often allows false claims to be given undue credence.
It is also frustrating that no reliable source of data exists for the activity level of home builders in the market.
Similarly, it’s impossible to get an accurate picture of the number of builders in the market or the proportion of homes delivered by national developers and local builders. Data presented as reflecting this is, again, based on a proportion of the sector and influenced by shifting market shares of the building control providers who provide the data.
An improved set of housing supply and house builder data would not only support better debate around the topic, it would also assist Government in setting policy; developers in making business decisions; and homebuyers as they enter the market.